Skip to content
If you are a part of high-functioning teams, you’re 110% using collaboration tools, communication platforms, and idea and innovation management software.
Because the way people work has changed completely over the last decade. Individuals, teams, and organizations work in networks now.
Moreover, organizations are healthily supporting people to take on innovation projects, collaborate with cross-functional teams, and communicate openly. And then there is another reality, the reality of hybrid working environments.
So, in this highly networked and interconnected world, organizational hierarchies set by traditional methods are completely obsolete.
How?
- People pick their own mentors, teams, homies, go-to people, role models, leaders, and co-innovators organically.
- Everyone now has the equal opportunity, resources, and support to participate in company challenges irrespective of their role, rank, designation, or experience. It’s no longer the “chosen ones” working for the growth and innovation of the company. It’s all hands in!
But what has this got to do with ONA?
Let’s look into the concept of an organization network.
What is ONA?
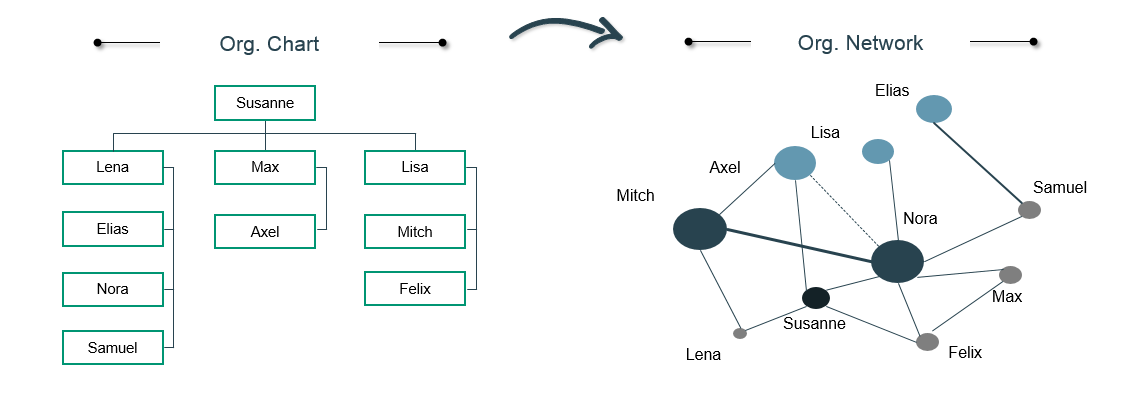
The definition of organizational network analysis is quite straightforward. When you provide a visual structure to formal and informal relationships existing in your organization, you create an organizational network analysis. Or better, you engage in ONA and find out how communications, collaborations, and decisions flow through your organization.
ONA is knowing that people choose their influencers and leaders. You cannot force a manager upon them. Sure, they’ll respect the set hierarchy, but always run to the leader they have chosen for mentorship, not the assigned manager.
You just need to map the organic collaboration and communication between people, teams, and different units of the organization. It enables you to uncover silos, communication gaps, innovation bottlenecks, and collaboration overload.
Source: Kienbaum
Organizational network analysis example
Let’s look at it through the lens of an ONA example.
Imagine your company is facing some common challenges, such as projects are often delayed, and there is a lot of confusion and inefficiency in communication.
So, as a leader, you decide to get to the bottom of this with Organizational Network Analysis (ONA).
You find out that people have joined informal teams outside their designated teams. They communicate cross-functionally for things they need, and they always know the go-to person for every single thing.
You gather data from various sources to see who’s talking to whom, who’s collaborating, and who’s getting left out of the loop.
After crunching the numbers and putting it all together, you’ve got this fascinating visual map of your organization’s network. You can see clusters of people who communicate a lot, but also some isolated pockets where information doesn’t seem to flow as freely.
Here’s where it gets interesting: you find out that certain individuals, like Jane from Marketing or Mark from Engineering, are these unofficial hubs of communication. They’re the ones everyone goes to when they need help or information.
And get this, they’re not necessarily high up in the hierarchy – just really well-connected.
Now armed with this data, you start making changes, implementing cross-departmental projects, encouraging more open communication channels, and providing training on effective networking skills.
And guess what? It pays off.
Maybe you see a 20% decrease in project delays, a 15% increase in cross-departmental collaboration, and employee engagement scores jump by 25%.
All because they took a closer look at their organizational network and made some targeted changes.
But this is all a bit too fictional. How to do an organizational network analysis?
How to analyze your organization’s network?
Mapping the ONA network is a crucial task that can be done in-house easily, given you have the right strategy and tools.
After you have clearly defined the objectives of the ONA and identified what you are trying to achieve from the data insights, you can start the ONA process.
For example, a study by Cross and Parker (2004) highlights how organizations use ONA to improve knowledge sharing and innovation by identifying key connectors.
#1 It always begins with data collection
To capture a comprehensive view of the organizational network, researchers must employ multiple data collection methods. Here are a few:
- Use Surveys to gain direct insights into employees’ perceptions of communication and collaboration patterns.
- Go through communication logs and email analysis to gain quantitative data on actual interactions. This can include email communication, chat logs, meeting schedules, organizational charts
- Leverage an idea and innovation management system. The innovation software gives you visibility into the true impact of the employees. It helps you measure and visualize workplace interactions, analyzing their frequency and strength.
Research by Borgatti and Halgin (2011) highlights the importance of triangulating data sources to ensure accuracy and reliability in ONA (Borgatti & Halgin, 2011).
#2 Choose your weapon, i.e., organizational network analysis software
Decide on the tools and techniques you’ll use to analyze the data. There are various software programs available for conducting ONA, or you can use manual methods if the dataset is small. Several network analysis tools are available for conducting ONA.
Research by Borgatti, Everett, and Johnson (2018) provides an overview of various software options, including UCINET, Gephi, and NodeXL, highlighting their features and capabilities for visualizing and analyzing network data effectively.
Selecting the appropriate tool depends on various factors, such as the complexity of the analysis and your familiarity with the software.
However, if your dataset is small and your goals not too complex, your idea-sharing platform works best for organizational network analysis. Here’s why:
A. Data Source for Network Analysis
Idea and innovation management software serves as a rich source of data for ONA. It captures interactions among employees, such as idea submissions, comments, votes, and collaborations. You can also map which teams and co-inventors submitted the most ideas or invention disclosures and which team got their ideas and disclosures pursued the most.
Analyzing this data provides insights into the structure of relationships and connections within the organization.
B. Identification of Key Actors
By analyzing the interactions recorded in the software, ONA can identify key actors within the organization who play significant roles in idea generation, evaluation, and implementation. These key actors may emerge as influential individuals who drive innovation or serve as gatekeepers in the flow of ideas and information.
And, since the software facilitates collaboration among employees by providing a platform for sharing ideas and working together on projects. You can analyze the collaboration networks formed within the software to understand how information and expertise flow among employees and teams.
#4 Start mapping & identifying key people in your organizational network
Use the collected data to create a visual representation of the organizational network.
This can be done by mapping out the connections between individuals, teams, or departments. Visualizing the network will help identify patterns and relationships within the organization.
Research by Brass, Galaskiewicz, Greve, and Tsai (2004) suggests that network maps can reveal structural holes, brokerage positions, and cliques within the organization, providing insights into communication patterns and collaboration dynamics (Brass et al., 2004).
Essentially, here’s what your ONA map will include:
- Central node: Individuals who hold a position of prominence or influence in the network. If your workplace is a bustling social scene, these people will always be in the loop about everything.
These central nodes might not be the big bosses or the loudest voices in the room, but they’re the glue that holds the network together. They’re the ones who effortlessly bridge the gap between teams, departments, and projects. - Knowledge brokers: These people act as bridges, connecting disparate groups and ensuring that knowledge flows freely across the network.
Think of knowledge brokers as the matchmakers of the workplace. They’re the ones who know who to connect with, whether it’s introducing a marketing specialist to a product development team or linking up a finance expert with a sales department. - Peripheral: Individuals or groups that are on the outskirts or fringes of the network. Unlike central nodes or knowledge brokers who play pivotal roles in connecting different parts of the organization, peripherals have fewer connections, and may not be actively engaged in communication or collaboration with other members of the network.
- Ties: Ties refer to connections or relationships between individuals or entities within a network. These ties can take various forms and represent different types of interactions, such as communication, collaboration, friendship, or professional relationships.
#5 Analyzing Communication Patterns
Dive deeper into the communication patterns within the network. Identify communication bottlenecks, information silos, and areas of collaboration. Pay attention to the frequency and nature of interactions between individuals or groups.
Kilduff and Tsai (2003) suggest examining tie strength, reciprocity, and multiplexity of relationships to understand patterns of trust, information exchange, and collaboration within the network (Kilduff & Tsai, 2003).
#6 Interpreting and Implementing Findings
Interpret the findings of the analysis in relation to your objectives. What insights do the data reveal about the organization’s communication and collaboration dynamics? Are there any areas for improvement or opportunities for intervention?
Ibarra and Andrews (1993) emphasize the importance of translating insights from the analysis into actionable interventions that align with the organization’s objectives and values. Effective interpretation and implementation of findings drive organizational change and improve network effectiveness (Ibarra & Andrews, 1993).
Benefits of conducting this analysis
#1 Optimizing return to office strategies with organizational network analysis
By analyzing network data, ONA helps identify key influencers, communication channels, and information flows. This information can inform decisions about office layout, team structures, and communication protocols to support hybrid or remote work models.
ONA also identifies employees who may require additional support during the transition, facilitates knowledge sharing, and fosters collaboration across distributed teams.
Ultimately, ONA enables organizations to design return-to-office strategies that enhance productivity, engagement, and employee well-being.
#2 Cost-benefit analysis
Improving communication efficiency can lead to cost savings by reducing the time and resources spent on unnecessary meetings, emails, or redundant processes.
Collaboration is essential for driving innovation and achieving organizational goals. ONA helps identify collaboration patterns and dynamics within teams and across departments.
By optimizing collaboration networks, organizations can enhance productivity, reduce duplication of effort, and accelerate decision-making processes, leading to cost savings and improved outcomes.
And, by understanding how teams are structured, how information flows, and how decisions are made, organizations can implement targeted interventions to streamline processes, reduce bureaucracy, and enhance agility, resulting in cost savings and improved performance.
#3 Speed up the culture of change and transformation
After you’ve analyzed and found out the people who fall under the central node and knowledge broker category, you can build a bottom-up approach to transformation.
Leveraging these key players can help disseminate the vision of change more effectively and gain buy-in from employees at all levels.
ONA also reveals potential resistance points or communication barriers that may hinder the adoption of change. By addressing these barriers proactively, organizations can overcome resistance and smooth the transition to a new culture or way of working.